Twitter Sentiment Analysis
- Personal Webapp for Practice
- Packages: Socket.io, Twit, Plotly, Languagedetect, Sentiment, Express
The Challenge:
This summer of 2017, I wanted to improve my skills in node.js as well as the implementations of different API's. In particular,
I wanted to try out Socket.io, a javascript framework and real-time engine.
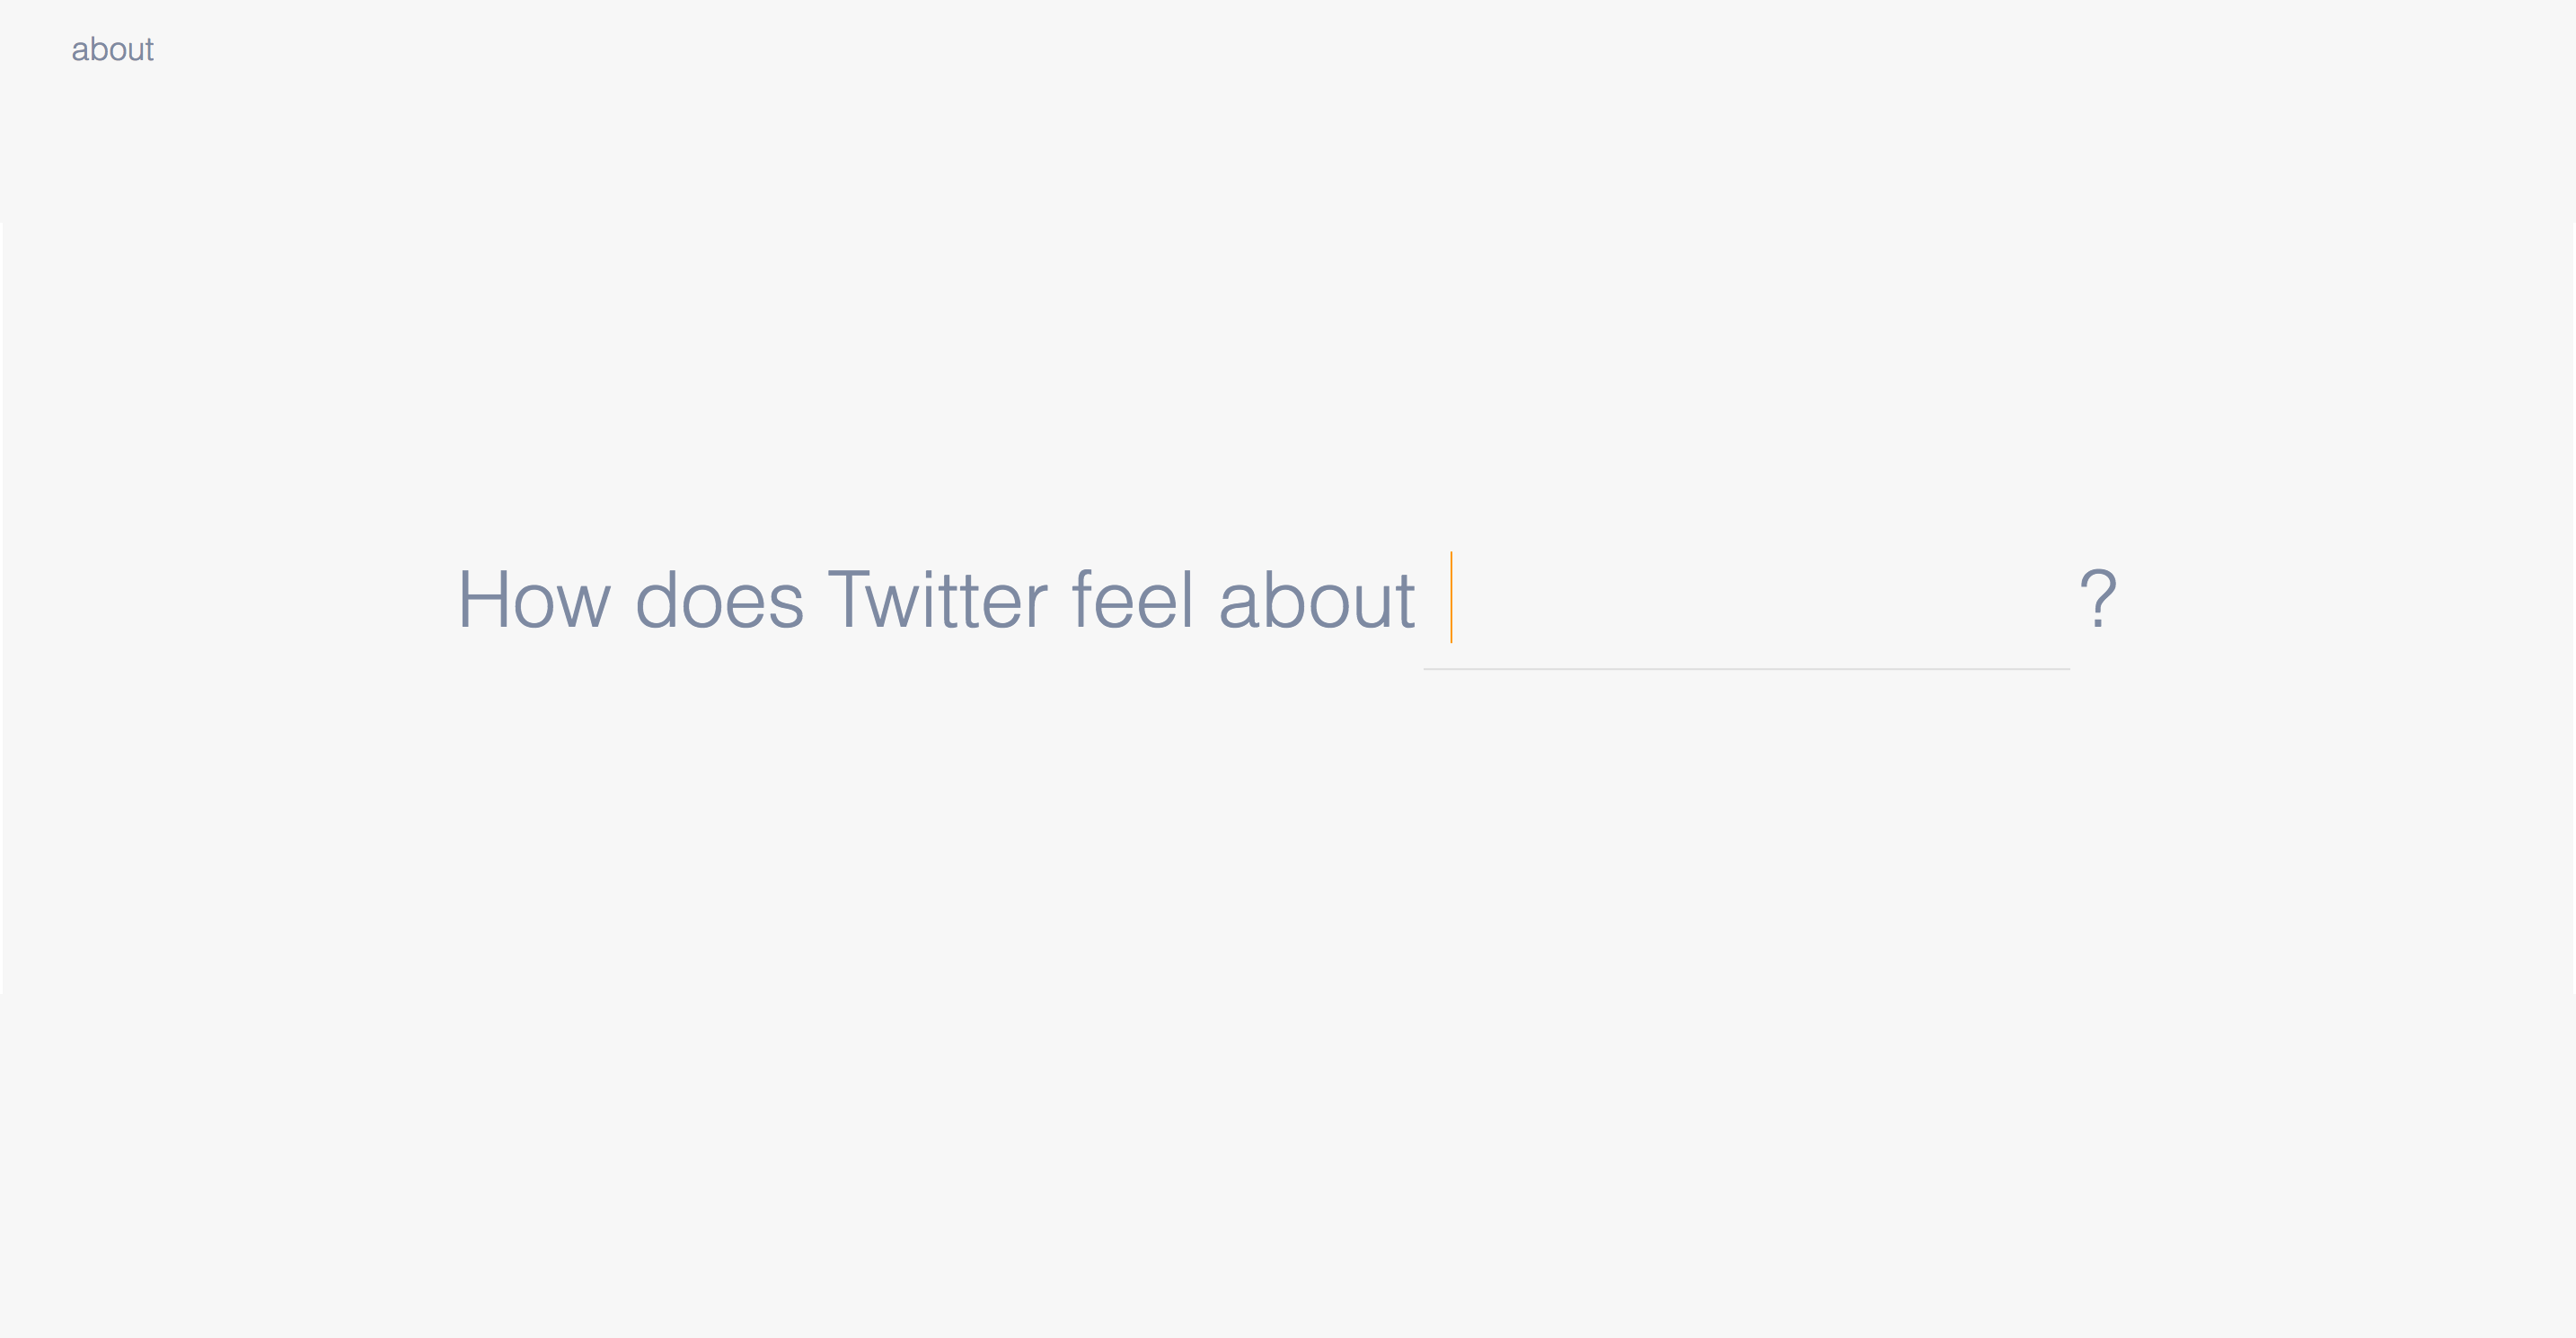
The Concept:
Opinions are fluid in its capacity to change based on current events, new ideas, and the changing environment. In order to
display how people are feeling about a certain topic through Twitter, this app takes in a user-submitted keyword
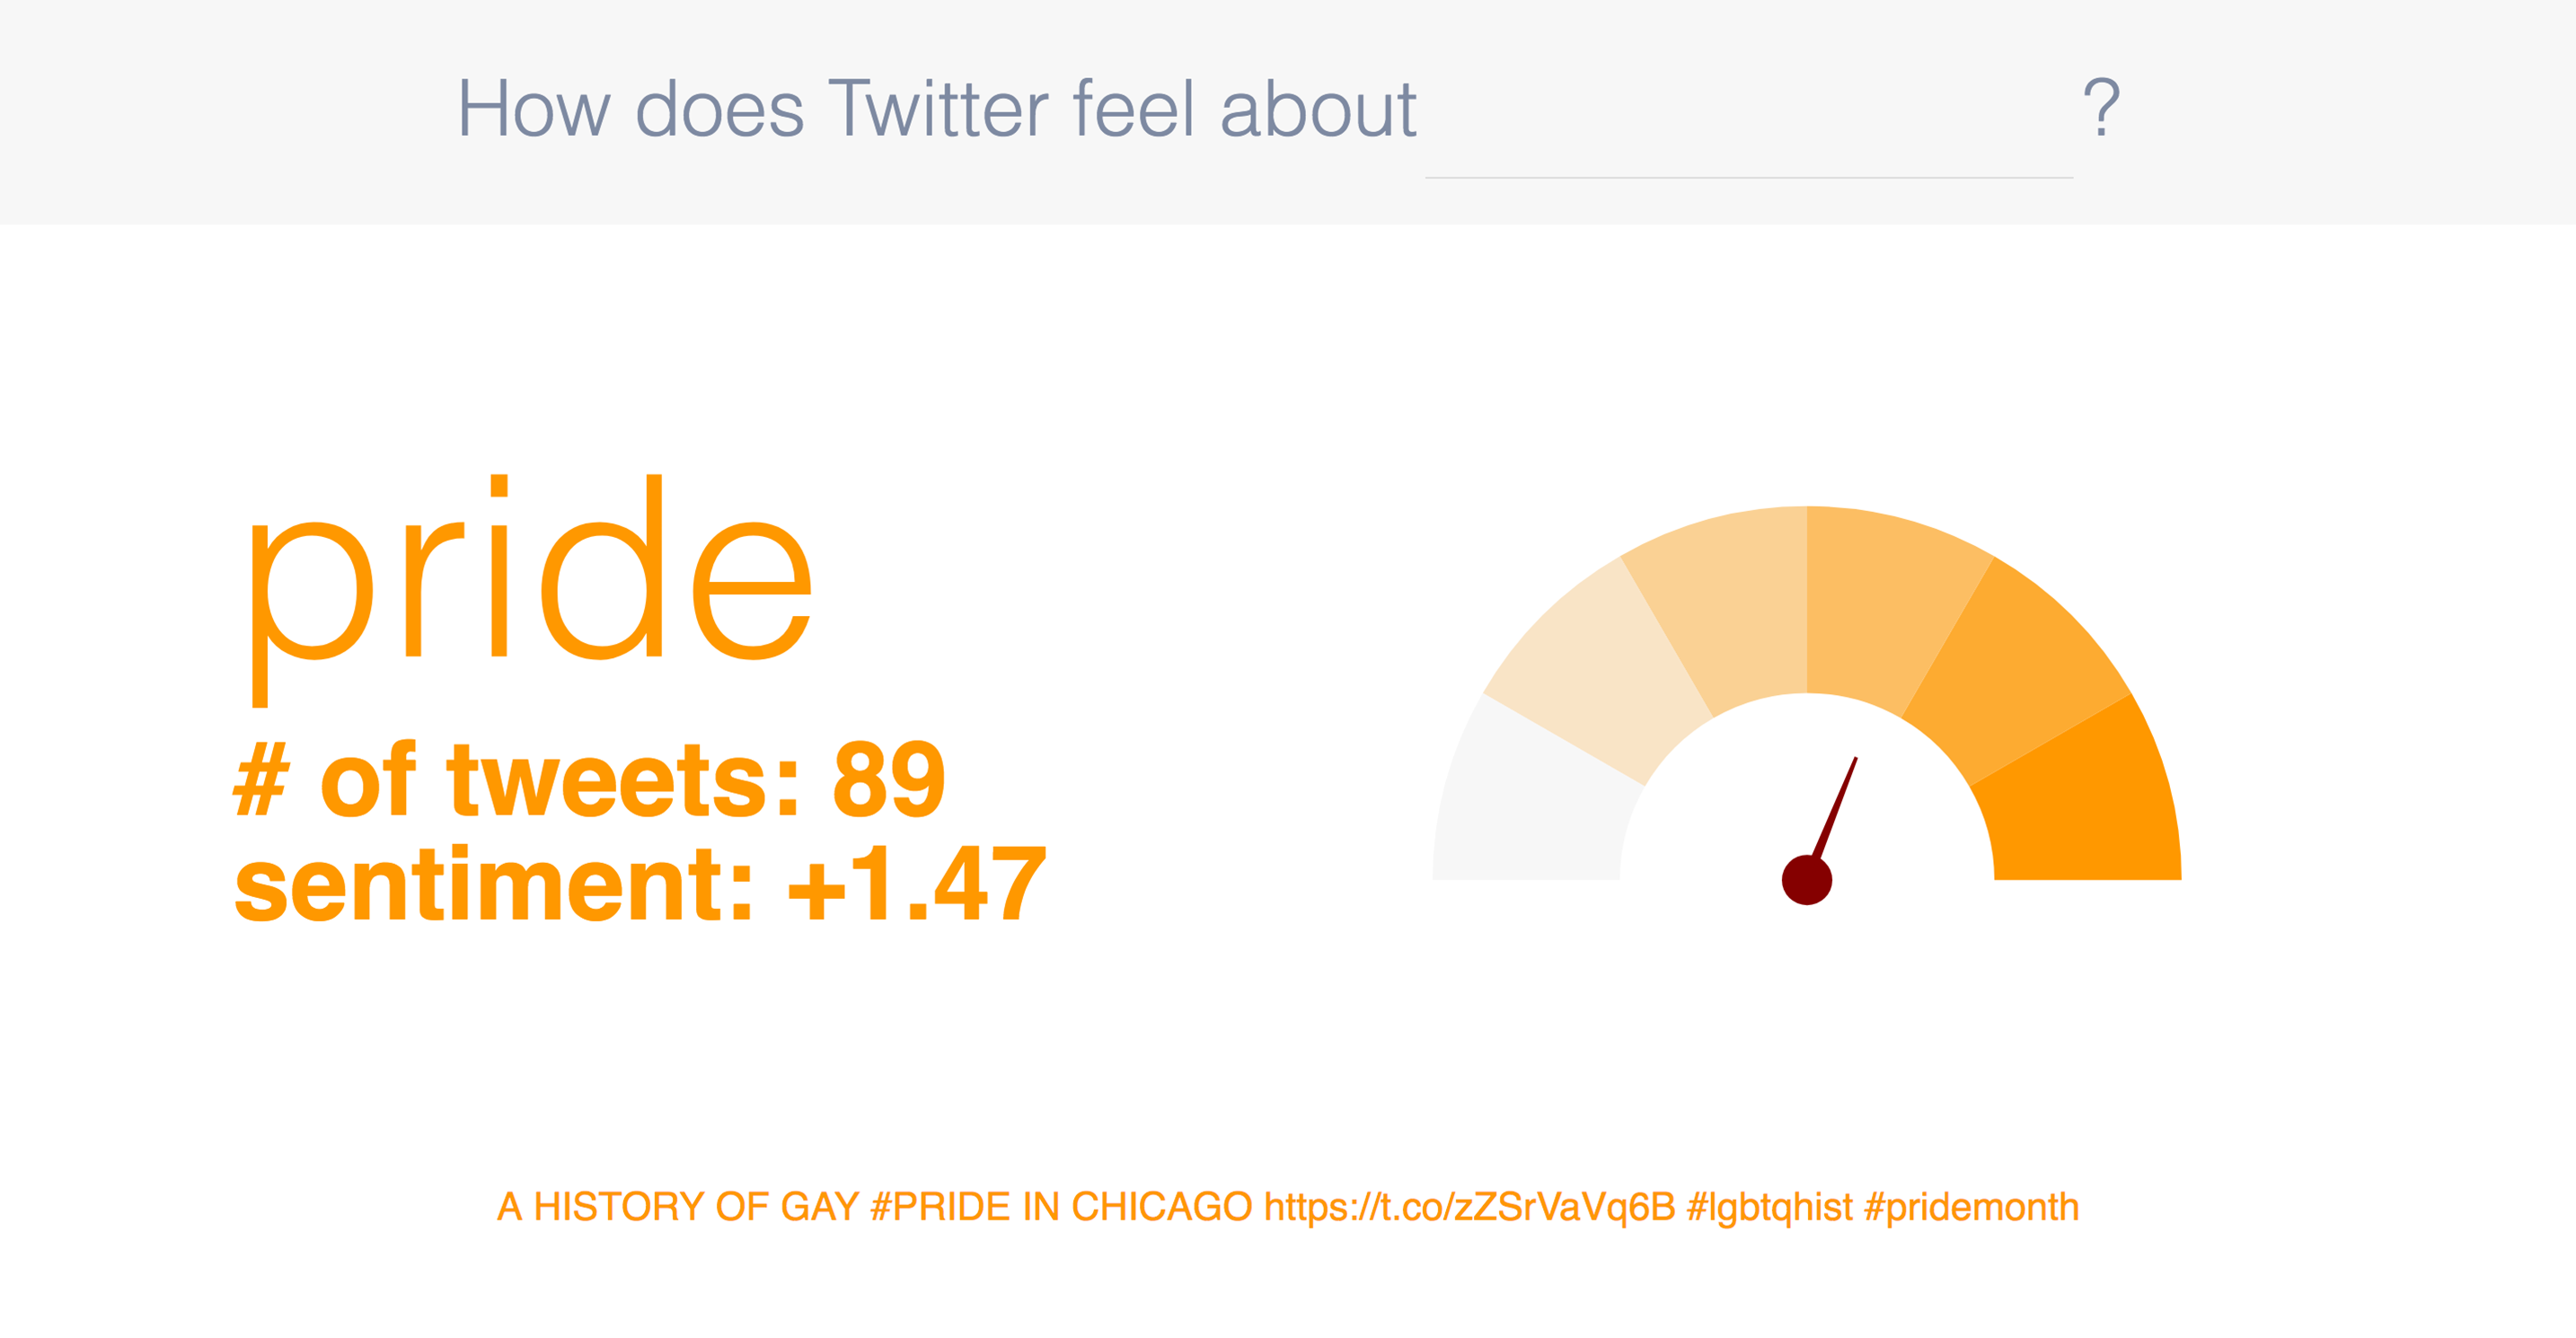
and initiates a live twitter stream on that keyword. As new tweets are posted, each tweet is parsed through a
language detector to filter English tweets, since the sentiment analysis API only supports English as of now.
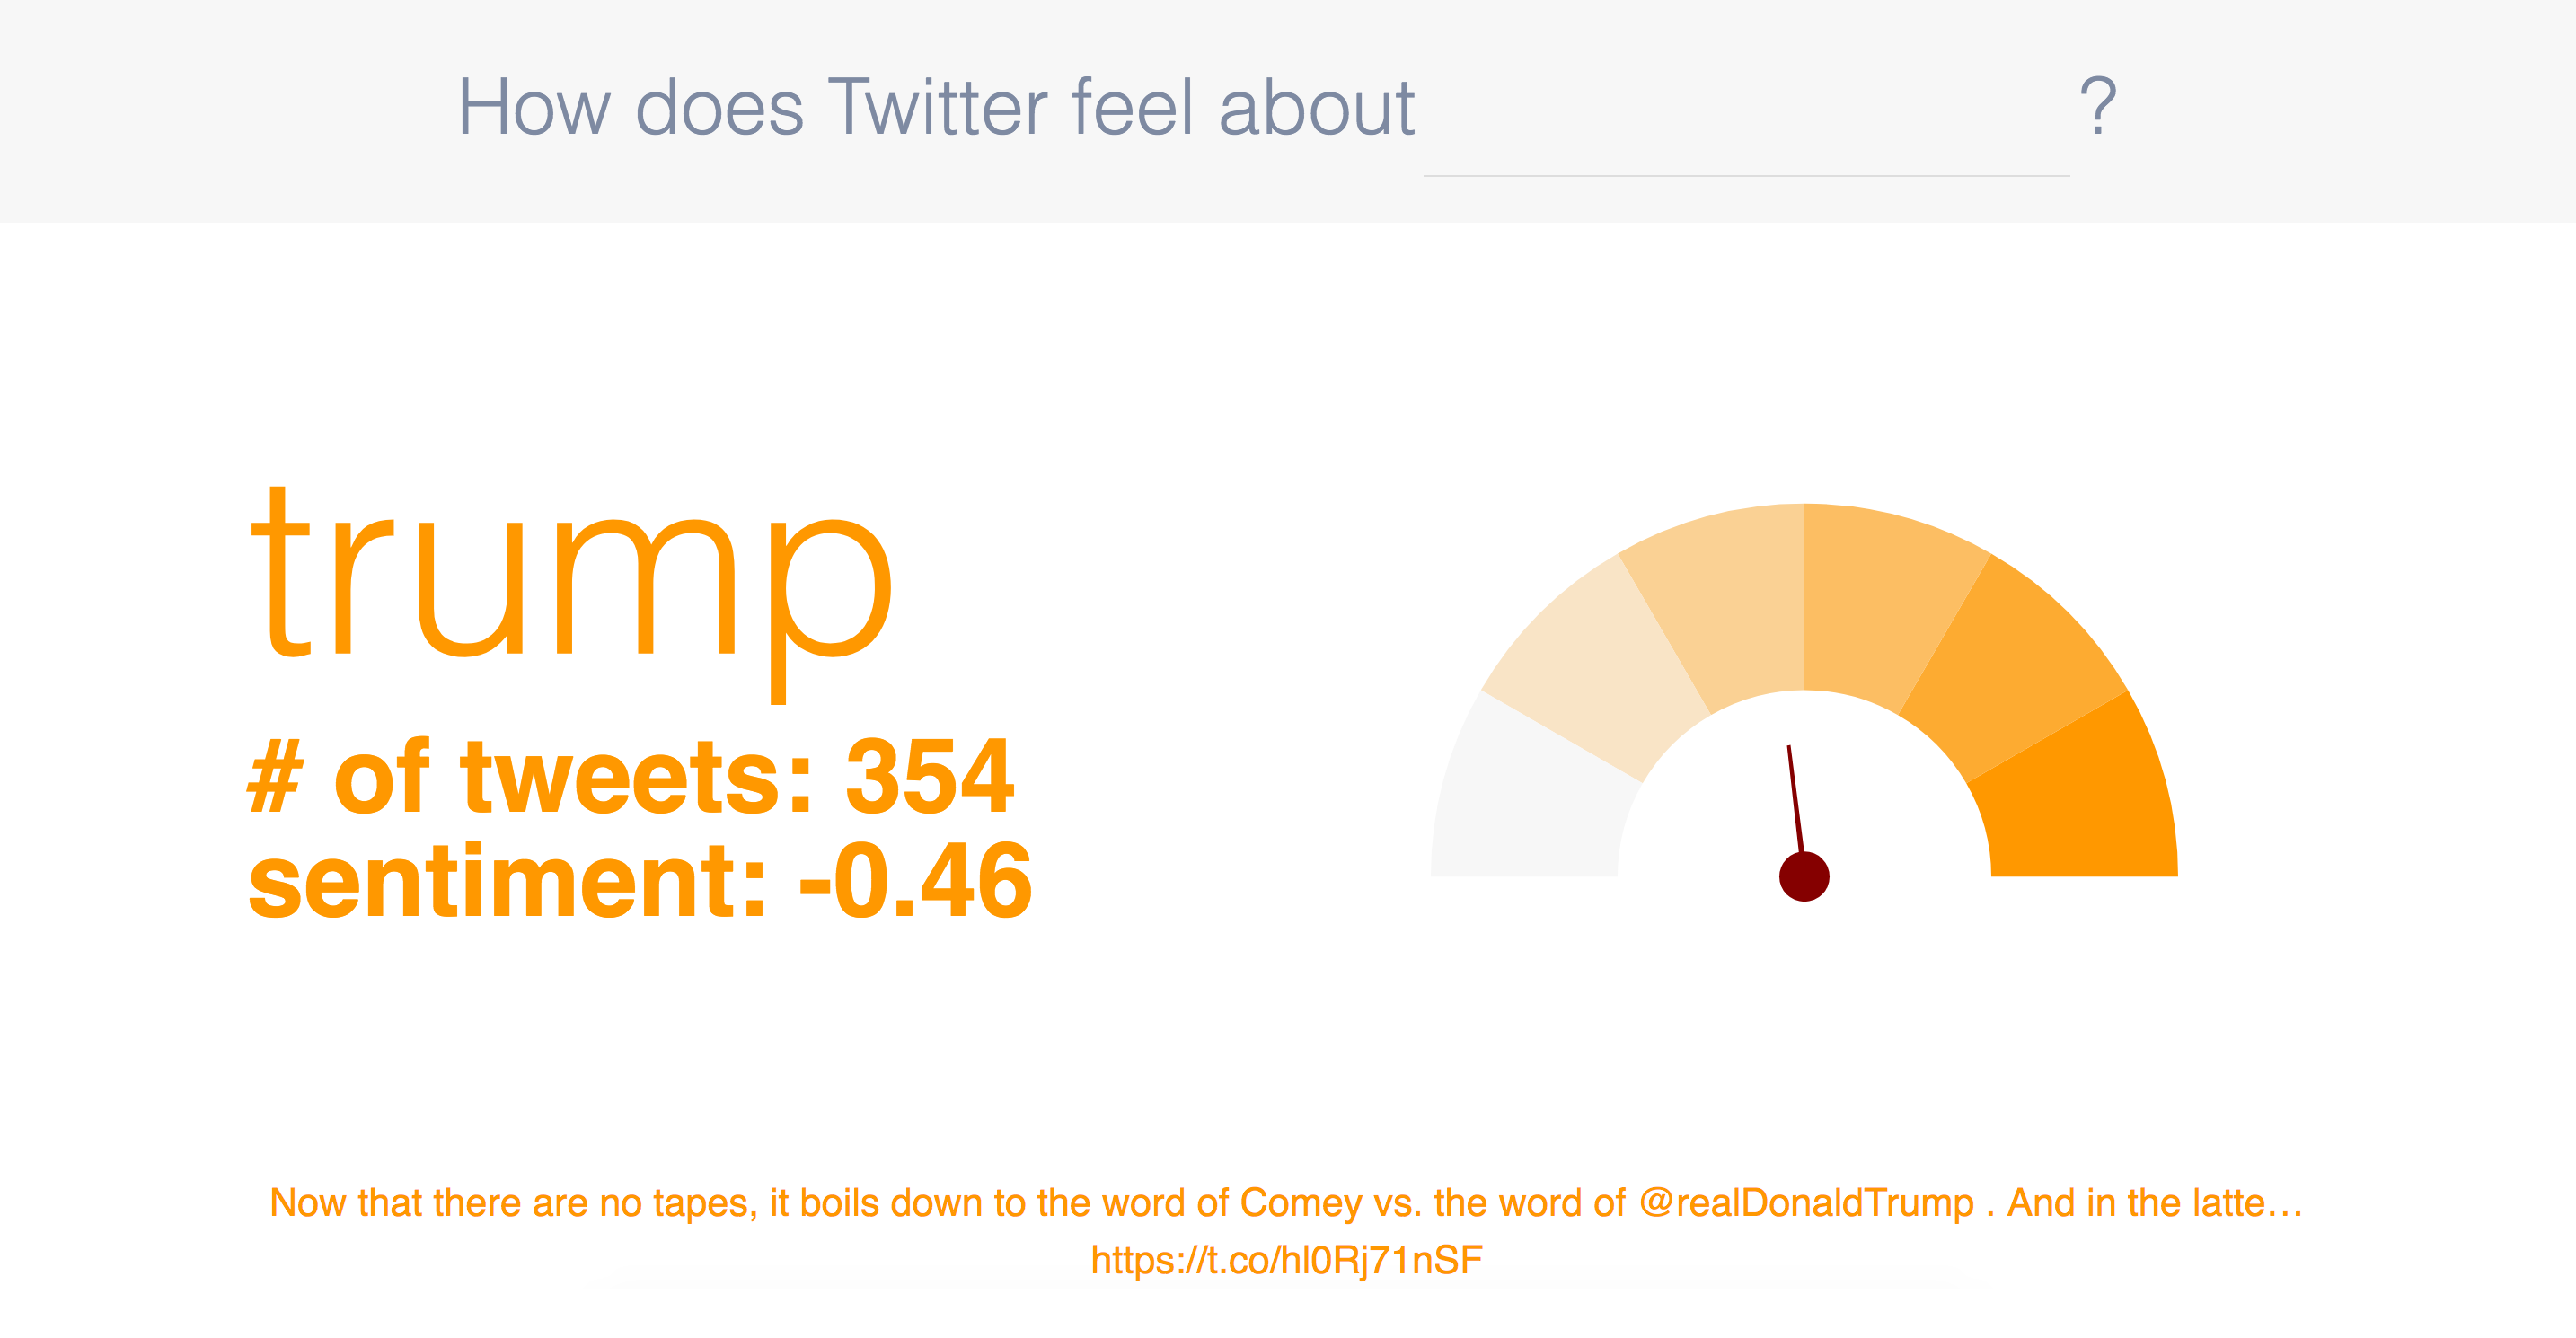
Each tweet is scored, with a negative score indicating negative sentiment and a positive score indicating positive
sentiment, and averaged into a total score which controls the gauge as a form of data visualization.
Difficulties:
It remains difficult to decide how data from this sentiment stream should be visualized; Most tweets are fairly neutral, and determining the minimum and maximum range of the gauge was dependent on the least and most extreme tweets encountered. By choosing this, the gauge's tick normally ends up towards the middle of the gauge, underutilizing the rest of the gauge's capacity. Working with plotly.js was also difficult in determining how to make the graph responsive to the viewport.
Final Thoughts:
This begins my start of learning to create apps with better practices. More work will be done in cleaning up and hardcode
that exists (particularly with modifying the plotly.js graph) as well as implmeneting async functions, and
I will be working more with this app in making it fully responsive. Currently, the app works for portrait orientation
tablet-sized and lower as well as landscape orientation for laptop screens.